New Protect insights dashboards for better risk visibility
We’ve launched new Protect dashboards to help you understand risk rules and performance more clearly across your setup.
June 2026
Clearer insights across Protect
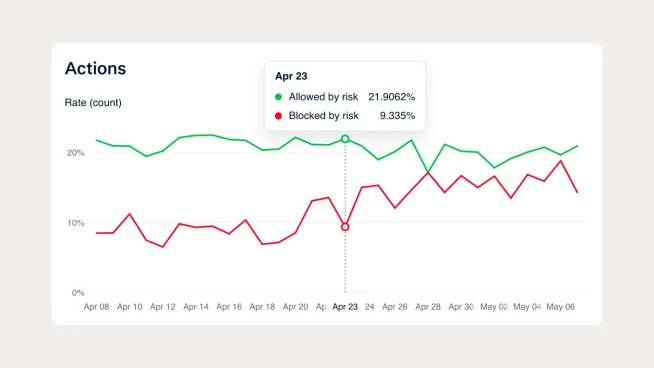
We’re introducing new Protect Insights dashboards to improve how you view and analyze risk performance. The new experience brings key metrics and rule insights into a more structured view, helping your teams identify trends and act faster on risk signals.
Designed for faster decision-making
The dashboards are built to simplify how you monitor Protect performance. Instead of navigating across multiple views, you can now access consolidated insights that make it easier to understand what is driving risk outcomes in your setup.
Get started
The new Insights dashboards are available in Protect from today. No action is required, and you can start using them immediately in your Customer Area. Customer Area > Insights > Risk & dispute management.
Latest updates
 Adyen for PlatformsProtect
Improve fraud detection accuracy with updated Score signals
We’ve updated Score account linking and fraud ring detection to reduce false positives and make investigations easier for your risk teams. The new setup gives you clearer visibility into which entities triggered specific risk signals.
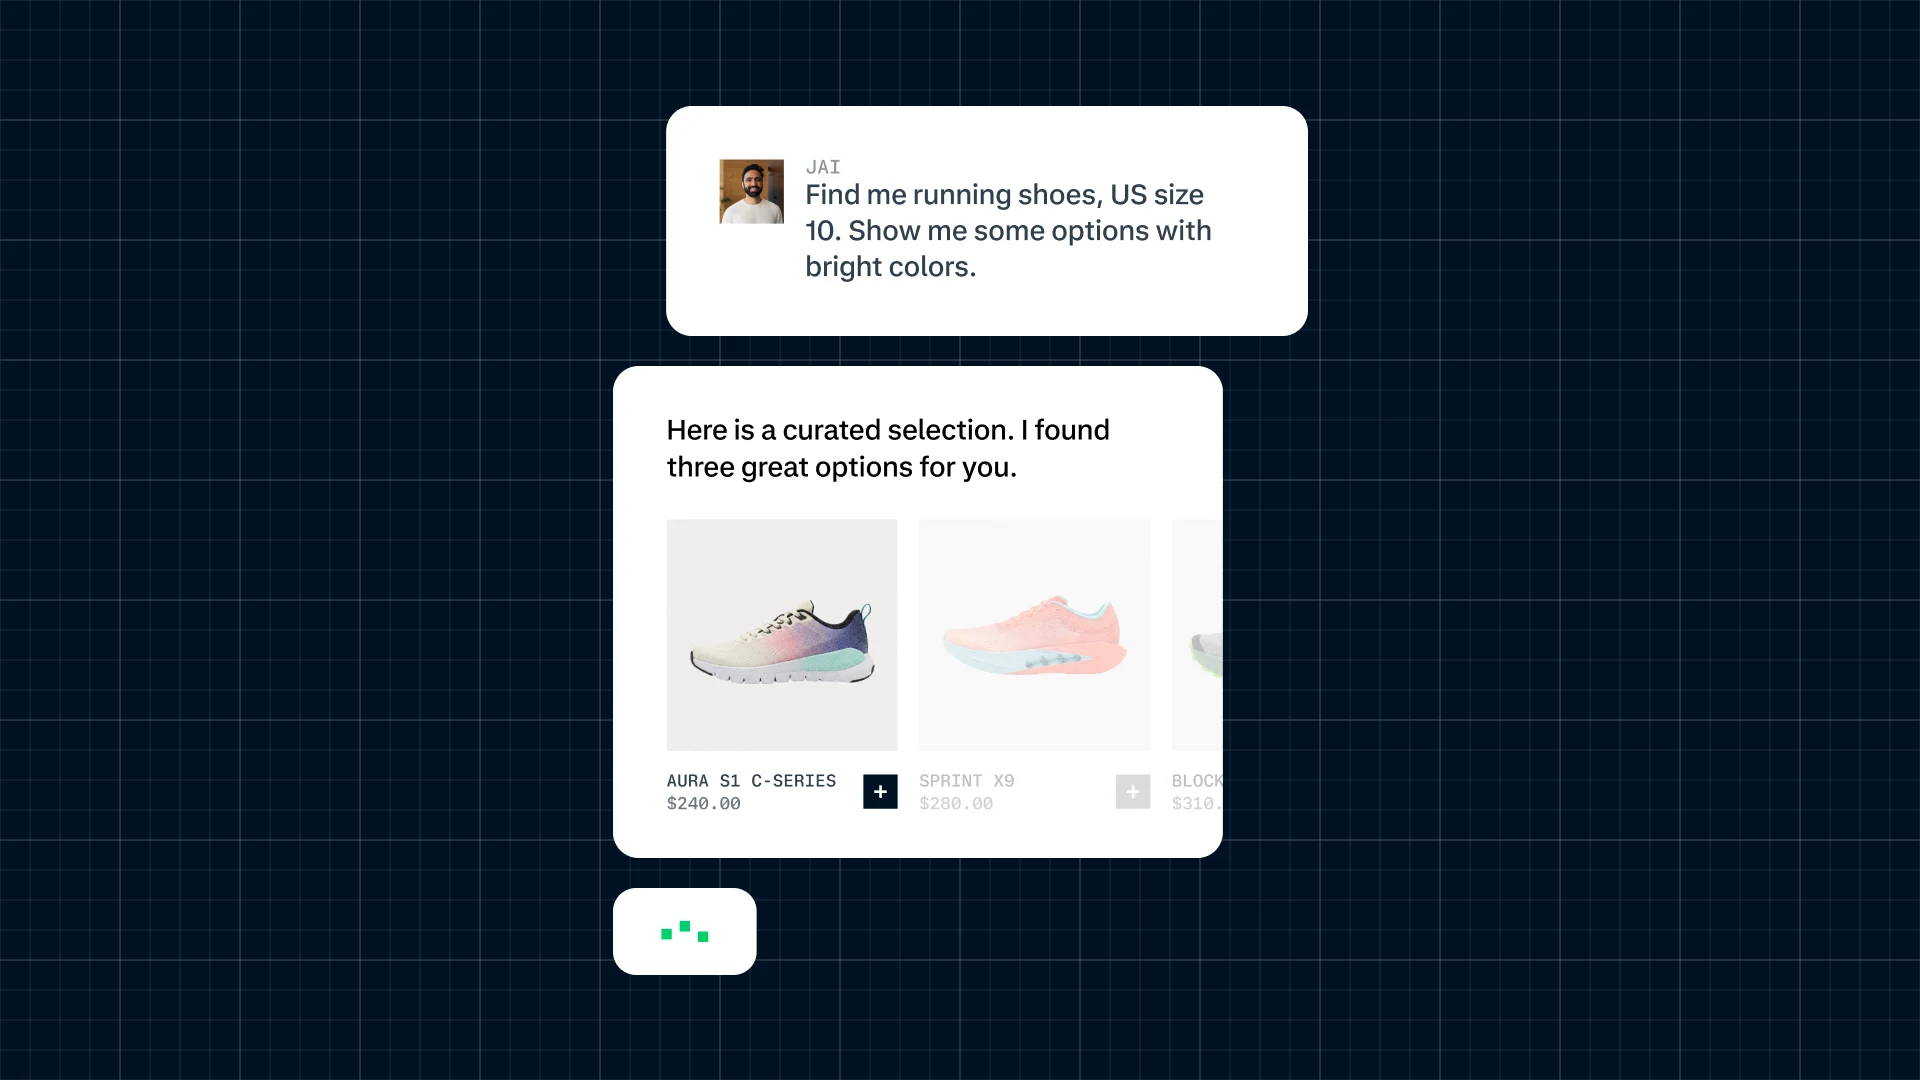
Introducing Adyen Agentic
An open infrastructure layer connecting your platform to the emerging AI ecosystem.