
Article
Tales from Observability: Implementing Service Level Objectives
By Alessandro Niciforo, Java Engineer, Platform Observability
We started a series of articles delving into our Observability pursuits within Adyen - Tales from Observability. In our first post, we shared about our learnings working with Elasticsearch: Elasticsearch Performance Killers.
In this post, we’ll go over the journey of implementing Service Level Objectives (SLOs) at Adyen from the point of view of a platform team driving the effort. We’ll take you through our approach, the obstacles we encountered, and the valuable lessons we learned along the way.
Where the journey began
At Adyen, we have gone through rapid growth for products/services, people and processes. Understanding the quality of the services offered from a reliability and performance perspective has often meant looking at multiple dashboards, and doing an evaluation on the spot. We wanted to make this understanding simple and accessible for every product and service, regardless of their maturity, to keep the bar high across the widening engineering organization.
Recognizing the potential of Service Level Objectives (SLOs) – a Site Reliability Engineering (SRE) practice pioneered by Google – to address this challenge, the Platform Observability team at Adyen took the lead. As a team deeply familiar with all the telemetry data being produced, we were particularly well positioned to implement the necessary tooling and to advocate for adoption of Service Level Objectives across the board.
What are Service Level Objectives?
Service Level Objectives serve as a means to define and track the desired level of reliability for a service, ultimately aimed at ensuring user satisfaction. SLOs don't aim for perfect reliability, which is often unattainable, but rather focus on establishing an acceptable threshold for errors over a specific timeframe. Additionally, SLOs provide a standardized language for discussing reliability matters.
While there is much more to say about SLOs, this article doesn’t delve deeply into these concepts. There are numerous resources covering this topic. The SRE Book by Google, for instance, features a dedicated chapter on this topic and is widely regarded as an essential starting point for further exploration. For the purpose of this article, we assume a basic familiarity with SLO-related concepts, such as Service Level Indicators (SLIs), error budgets, and burn rates.
Building an SLOs framework
In line with the principles outlined in "Team Topologies" by Manuel Pais and Matthew Skelton, our primary objective as a platform team is to provide capabilities to stream-aligned teams with a minimum impact on their cognitive load. Considering this tenet, it became apparent that expecting every team across the organization to independently explore and implement SLOs would be impractical. Instead, we wanted to deliver a technical solution that streamlined the process of defining and monitoring SLOs while adhering to industry best practices.
This realization led us to establish our initial requirements: the solution had to be applicable to all engineering teams within the company, necessitating a cross-platform approach. Recognizing the sheer number of teams we couldn't support individually, we aimed for a self-service solution — one that is user-friendly and comprehensively documented to empower teams to adopt SLOs autonomously.
At Adyen, we use open-source software or we build in-house. We set out to research existing solutions in the open-source community and we found two main projects that would help shape our vision: OpenSLO and Sloth.
OpenSLO is a vendor-agnostic YAML specification for defining SLOs. Instead of coming up with our own specification we could just use one that has been designed by industry leading experts who have worked with SLOs for years already.
Sloth is a Go application to generate SLOs for Prometheus, including alerts and Grafana dashboards, starting from YAML files. Prometheus was already a core component of our monitoring infrastructure so it only made sense to double down and build on top of it.
While Sloth is simple to use and feature-rich, we wanted to have maximum freedom for customization so we decided to build our own tooling following a similar approach.
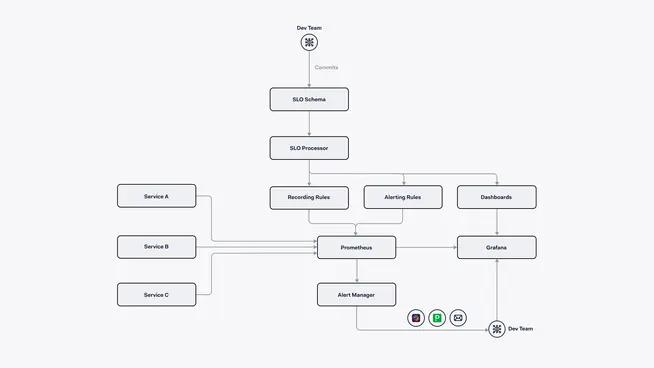
Development teams would be responsible for instrumenting their application with the necessary metrics, and also for committing their SLOs as YAML files, according to the OpenSLO specification, to a Git repository. These YAML files will contain:
the Service Level Indicator as a query for Prometheus
the reliability target as a percentage
and some metadata such as: team name, application name, and service name.
These files would be parsed by a processor that generates recording rules (used to pre-compute the result of the SLI’s query) and alerting rules for Prometheus, and dashboards for Grafana. We started referring to this solution as the SLOs framework.
For the purpose of this article, we will be referring to the internal users (other Adyen employees) of the SLOs framework as “users” and to the users of Adyen’s platform (Adyen’s customers) as “end-users”.
Capabilities of our SLOs framework
The backlog of features to implement started growing very quickly, and we had to be careful in prioritizing what really mattered in order to have a Minimum Viable Product (MVP) to start onboarding users early on. We wanted to focus on the 20% of work that would serve 80% of users. Following are some of the most important capabilities we decided to have for the MVP.
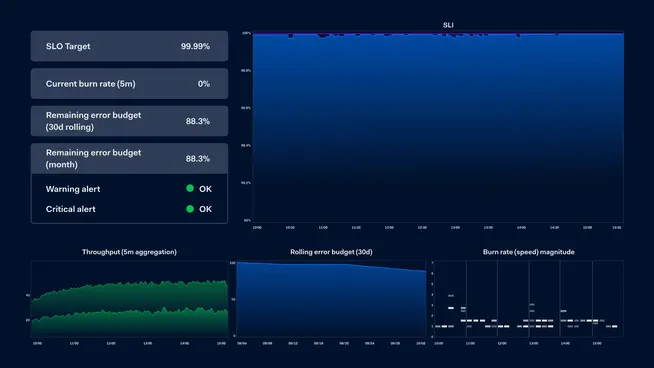
Per team dashboards
We wanted to put the team first and make sure each team has their own dashboard where they see only the SLOs relevant to them. In this dashboard there’s a standard set of graphs for each SLO, no matter the data source, category or business domain. Any person in the company should be able to look at any SLO graph and immediately understand its meaning.
Overview dashboard
While development teams are mostly interested only in the services they maintain, other teams – typically operations or support teams – are interested in the holistic view of the platform. We made sure to provide an overview dashboard where services are grouped by business domain (e.g.: core payment services, onboarding services, testing services, etc…).
Multiwindow multi-burn-rate alerts
Alerts are difficult to get right. Too frequent alerts generate alert fatigue and will eventually be ignored. Too infrequent alerts may not trigger for actual problems and we would lose users’ trust. Google’s SRE workbook proposes multiwindow multi-burn-rate alerts as a solution and we implemented them by the book. In short, an alert is configured to trigger only when the burn rate goes over a specific threshold for two time windows: a shorter one and a longer one.
For instance, if we’re facing a spike of errors and the burn rate of a service is high for the past 5 minutes but it isn’t for the past hour, we don’t know yet if it’s an occasional burst or if it’s an actual problem that needs attention. Conversely, if the burn rate for the past hour is high but it isn’t for the past 5 minutes then the service might have recovered already.
Drill-down links
We wanted to streamline the investigation journey from SLOs to root cause. Users could add drill-down links that would be displayed in their dashboards and alerts. If the metric is produced from a known framework, then we generate these links automatically.
Educational initiatives
The tooling we were building could only take our users so far. The true challenge laid in getting the process right and in meticulously defining the most relevant indicators and objectives.
Indicators will always be proxy metrics for end-users' perception. It’s important to use metrics as close to the end-users as possible and to focus on symptoms rather than causes. A good indicator measures the latency of a service as perceived by the end-user, not the CPU usage of the underlying server.
Objectives should accurately represent end-users’ satisfaction. In certain instances, the existing SLI value at the time of adopting SLOs can serve as a useful initial benchmark, assuming that end-users are reasonably content with the current service. However, this assumption should not be made without validation. It's crucial for the objective to be practical and attainable; setting an overly ambitious objective, that is never met, serves no purpose.
We organized and hosted several live workshops to walk other development teams in the company through these concepts, demonstrating real-life examples and engaging in discussions to help them determine suitable SLIs and SLOs tailored to their unique situations.
We wrote extensive documentation so that any team could at any point in time start implementing SLOs on their own without our help. While we took a proactive approach, offering our assistance and remaining accessible, teams had the freedom to proceed autonomously.

We appeared on stage in a few engineering meetings where all engineers come together to share projects, learnings or dilemmas. We took advantage of these critical opportunities to evangelize adoption of SLOs to the rest of the company. We wanted everyone to know what SLOs are and how to get started. Additionally, we aimed to establish personal connections by introducing ourselves, so that anyone interested could easily reach out to us directly for guidance or collaboration.
These educational and outreach efforts took place prior to the completion of the SLOs framework. This approach enabled us to raise awareness and establish connections with users who were eager to embrace SLOs early on.
Piloting SLOs
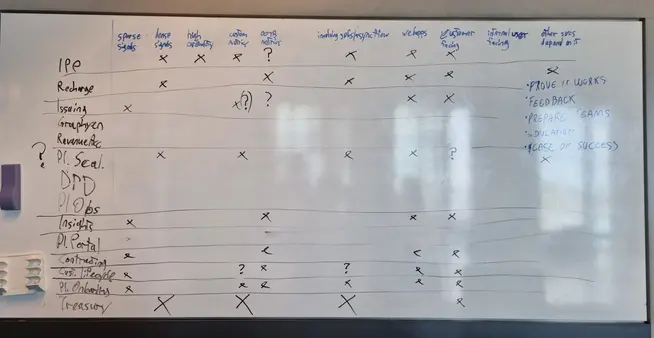
A guiding principle everyone in Adyen follows is launching fast and iterating. True to this principle, we wanted to onboard teams as soon as we had a working, although imperfect, product. When the MVP was ready, we already had a list of teams that expressed interest in participating in the pilot phase. We picked them based on the characteristics of the services they own, aiming for a heterogeneous set of services that would cover multiple use cases.
The selection was based on:
Traffic pattern (e.g.: scattered or continuous traffic)
Metrics footprint (e.g.: high cardinality or low cardinality)
Need for custom instrumentation
Synchronous vs asynchronous processing (e.g.: a web service vs a job)
External facing service vs internal facing service
We added an extra team to the pilot, our own. There’s no better way of discovering the user needs than being a user yourself. Among our team’s responsibilities there’s the maintenance and development of an event-based monitoring application which would become the first service to be onboarded on the SLOs framework. This helped us with finding and fixing bugs, writing a step-by-step guide for users, and having a working demo to showcase the product’s capabilities.
We then scheduled individual kick-off sessions with each team’s representative to build a direct line of communication. We helped them with reasoning about objectives and indicators for their service, and we directed them to the right resources to get started. Even more importantly, we explicitly asked for feedback as early as possible, without waiting for any formal moment to do so.
Challenges
It wasn’t all smooth sailing. We faced various challenges throughout the project:
Low traffic endpoints
Some services have a very peculiar traffic pattern, with a low amount of requests scattered throughout the day. We had cases where an endpoint could receive just about 5 requests in an hour, 100 requests the next hour and nothing at all after that. One off-target request in the first hour means 20% error rate for a time window of 1 hour but less than 1% for a time window of 2 hours.
The default alerts, with a shortest time window of 1 hour, weren't well-suited for this scenario. We introduced a low volume alerting profile with a minimum 24-hour window which remains unaffected by intermittent traffic. Users have the flexibility to select the alerting approach that aligns most effectively with their service, ensuring a heightened confidence in the reliability of alerts.
Service dependencies
In Adyen, as in many mature organizations, most services depend on other services which they have to call before responding to an incoming request. These dependencies may be owned and maintained by different teams. An engineering team may feel the need to look at the reliability of their service alone excluding its dependencies, assuming that each dependency is already covered by its own SLO. While it sounds reasonable, such an approach can be risky for a few reasons:
Not all dependencies have SLOs. This is the safe assumption to make. At the end of the day, you are responsible for your own service and you should be aware if you’re not delivering a quality service anymore, even if it’s not your fault.
You don’t know how the dependency’s indicator is instrumented. It may not take into account network transfer time or the added latency of a reverse proxy, for example.
Perceived urgency may differ across services. The owner of a dependency may not be aware of the impact that a drop in their service level may cause to other services.
We reiterated these points several times with our users to sensitize them to the matter.
Prometheus knowledge
Even though PromQL, the Prometheus query language used to retrieve metrics, doesn’t have a steep learning curve, it’s not as commonly known as other query languages such as SQL. Users of the SLOs framework had to become proficient enough to write their SLIs as PromQL queries. We made sure to provide documentation, video tutorials, SLO-specific examples and, of course, our assistance.
Non-engineers working on SLOs
We discussed the possibility of implementing a user interface for defining SLOs but ultimately decided against it. The rationale behind this decision was that the majority of teams would have an engineer working on SLOs, who would be comfortable working with YAML files in a Git repository. However, it wasn’t the case for all of them and, in a couple of instances, product managers sought the ability to independently iterate over their SLOs. Unfortunately, this was not feasible, therefore they had to rely on the assistance of engineers in their teams.
Our Results
We received very positive feedback early on. Many teams identified and addressed issues right after their first implementation of SLOs.
"Really nice find, our error dashboard did not show this one :)"
They started iterating, refining their objectives, and they started to feel more in control of their service’s performance and reliability.
"We actually found a bug because of the SLOs. A query was not using an index"
Today we have more than 700 SLOs in place and counting. As our journey continues, we remain dedicated to refining our approach, enhancing our framework, and ensuring that SLOs continue to serve as a critical component of our commitment to service excellence. We look forward to further growth, learning, and innovation in our pursuit of service reliability and customer satisfaction at Adyen.