Article
We built Architect for humans. Agents made it transformative.
Explore the engine behind Adyen's platform brain. Processing up to 7 million traces per second using Kafka, Apache Flink, and Neo4j, Architect unites our runtime, compile-time, and infrastructure data. Learn how this foundational graph turns AI into a genuine reasoning partner.

It's 3am. An engineer gets paged. A service is throwing errors, and the first question is always…
What actually depends on this thing?
(Ok, maybe the second question, after "Oh no, what's happening?")
Answering it used to kick off forty-five minutes of tab-juggling… traces in one window… the repo in another… a bit of Slack archaeology… and an architecture diagram that was last accurate sometime around the previous reorg. (Or, failing all that, trying to wake up the person who actually knows.)
We built Architect to make that question answerable. The goal was simple enough: a near real-time, queryable map of how our platform actually fits together, stitched from three graphs:
A code graph of roughly 250,000 classes across 6,000+ modules.
A service graph of around 3,000 live services and the ~470,000 calls between them.
An infrastructure graph of tens of thousands of hosts spread across tens of data centres.
It turns out no single person can hold all of that in their head. (And extracting the brains from multiple engineers' heads was apparently frowned upon).
Then we gave our agents the same map, the same factual foundation, and the forty-five minutes became a few seconds.That second part is the one we didn't fully see coming. It's also what this post is about.
Architect is built to become Adyen's living brain for agents and humans, and it's only finishing elementary school.
Observed architecture beats imagined architecture
Most workflows (for both agents and humans) share the same failure mode: they’re guessing. Interpreting. Reconstructing the platform from partial context and a hopeful vibe, burning tokens (or brainpower) the entire time.
Before Architect, if you wanted an agent to answer a real question about the platform, it first had to read the platform. Raw source across every repo, raw logs, the lot. We tried it. Our monorepo alone runs to hundreds of thousands of files, and it's far from the only one. Production generates up to 7 million tracing spans per second, so "just feed it the context" turned into hundreds of millions of tokens before we admitted there had to be a better way.
You might instead decide to read architecture diagrams. These are usually correct in spirit and approximate in detail. That is not a criticism. It is just what happens when systems evolve quickly, teams move fast, and reality keeps contributing fresh material.
Architect is that better approach.
Instead of relying on static diagrams or manual mappings, it continuously builds an understanding of how the platform behaves and how its code is structured. That gives engineers a living model rather than a one-time sketch.
It gives agents a factual substrate: pre-computed, verified, and queryable. If it exists in the graph, it is happening. No interpretation. No hallucination. No "based on the code I've seen so far." This also reflects practical reality, not perceived reality from design docs or expired assumptions.
A single graph query returns what would otherwise be thousands of lines of context the agent has to read, hold in memory, and hope it reads correctly. One query. And it's true.
Now we can answer questions that used to take an afternoon:
"Is this runtime dependency actually referenced in the code, or can we drop it?"
"There's a monkey loose in the data centre unplugging racks. Which critical flows go down, and what do we shift where?"
"Can we modularise this service without quietly breaking a production caller?"
Those are cognitively expensive questions for a human. You're holding three datasets in your head and joining them by hand, on a good day, correctly. (Again: still not allowed to extract everyone's brains, apparently.) An agent doesn't care. It's joined all three before you've finished reading the question.
Three graphs, one agent conversation
Architect connects three domains that normally live in three different tools, owned by three different teams, described by three different mental models:
Runtime: what's happening in production right now. Which services call which, where pressure is building, whether we stay standing when something falls over.
Compile-time: how the code is actually put together. How coupled things are, the blast radius of a change, which dependencies are load-bearing and which are just… there.
Infrastructure: where workloads physically run, how compute is spread, and what happens if we lose a rack or an entire data centre.
We then have the ability to bridge all this of these by using a composite database (thanks Neo4j for this feature, super useful)
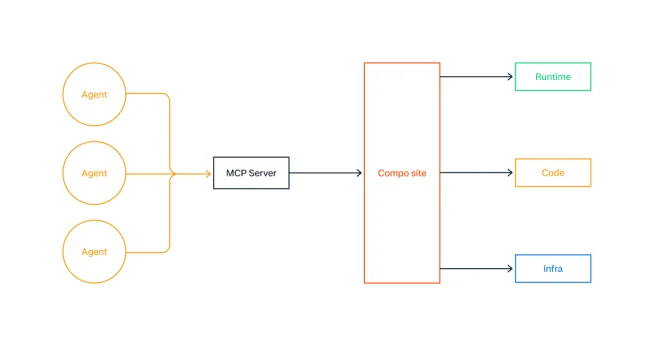
And having three graphs we can connect is cool and all… but I know what you’re thinking (especially if you’re an engineer)…
What’s under the hood
Alright, time to get semi-technical. We’ll dive deeper into each of these in future posts (because each of them is actually pretty interesting).
But to give some teasers… our ingestion looks like this.
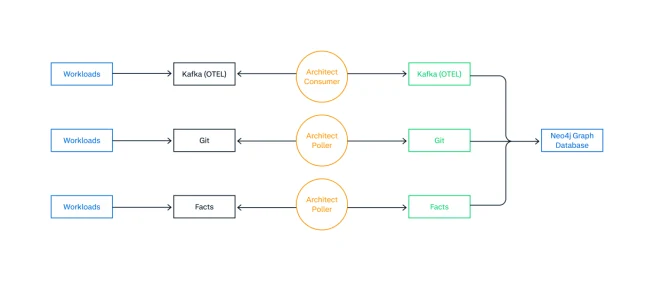
So what are we looking at?
Let’s start at the top… which is our runtime data.
It's traces. Yep, that's genuinely it.
All our workloads in all of our environments are constantly emitting trace data, which is being fed to Kafka, and a consumer is picking it up.
Now, our “super secret ingestion pipeline” is… Apache Flink.
Flink itself is picking up every single trace emitted (7m per second), and going through a pipeline, where we do some filtering, internal-app correlation (this webapp is calling that webapp… but why), cross-app correlation (just a bunch of linking seemingly disjointed spans), extraction, aggregation, and writing.
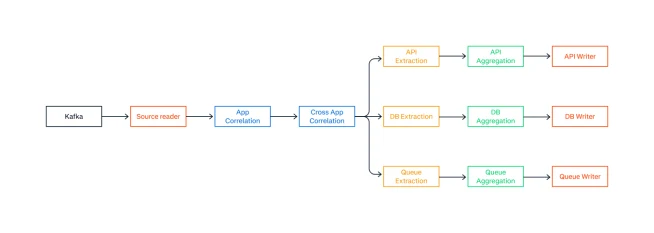
A bit of a high level overview on what our Flink pipeline looks like, there’s a bunch more we split out based on the other components, but that’s pretty much it!
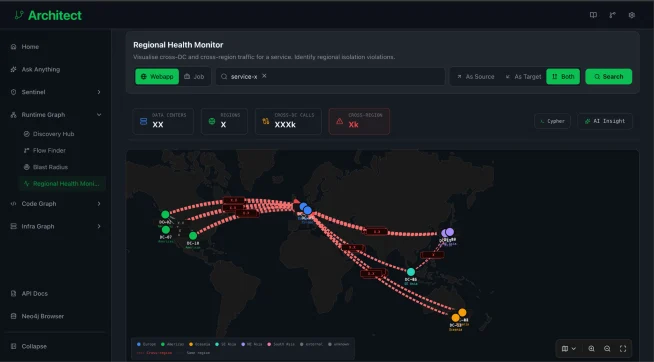
Here's a sneak peak of an actual application of the Runtime Graph: a regional health monitor UI which analyzes cross-region traffic. Here we’re analyzing a badly behaving dummy app for dramatic effect.
So, yeah… don’t worry, this isn’t real data getting passed around.
And the middle… our code graph.
Alright, this one is slightly more complicated.
We have a Java monorepository, and that main repository has a lot of files… and building the whole thing from scratch annoys our DevEx team as I hog all the runners. Meaning we had to do something different.
We used Flink again.
I mean it worked the first time and this isn’t the definition of insanity, right?
What we focused on here was incremental builds. We tried full builds every 4 hours, which eventually became very painful.
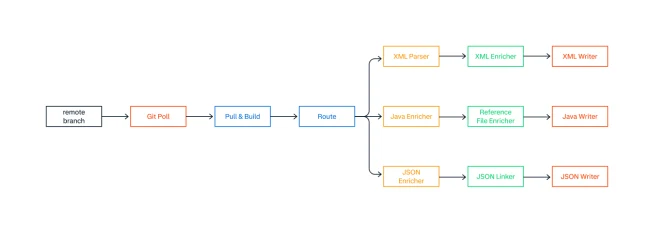
Inside Flink, our source reader is actually a git poller, inside a rather large TaskManager container with a cloned repository, fully built. Then the poller starts polling. Any time the head ref changes, we pull, kick off an incremental build (so only the changed files are rebuilt), split them into their types (each with a reference to its source file), parse and enrich them, then write.
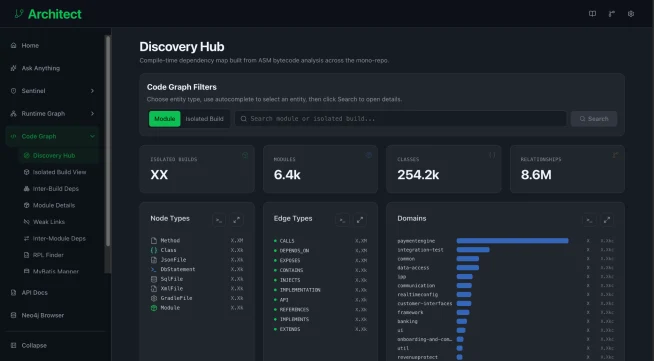
Same same, but different. Again, a nice anonymized view of the actual UI. You can see a nice summary of the state of our codebase, along with different applications for this graph in the sidebar.
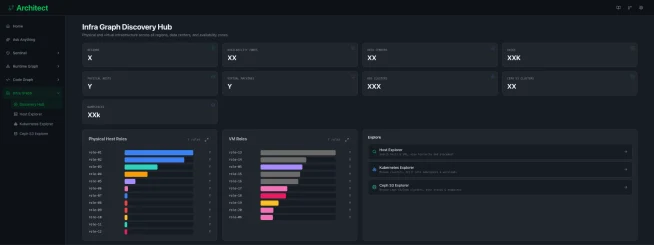
Now to the bottom… our infra graph.
We have a comprehensive Facts database that continuously captures ~900 metadata items from every bare-metal or virtualized host in our fleet. This includes server specification, OS and kernel configs, networking setup and info, security and access, installed software, runtime hardware detail and much more. We focused on facts relevant for the bigger picture:
The full hierarchical mapping: platform region -> infrastructure region -> availability zones -> data center -> floor -> rack -> physical host -> virtual machine.
Function: compute, storage, kubernetes worker, kafka host, etc
Meta information: role, environment, owner, first seen, last seen, etc.
Getting this information is simple. No Flink here, just a combination of a builder job, creating the skeleton, and some enrichment jobs to add a couple of other things from different data sources… It's effectively a series of cron jobs.
And as our infrastructure doesn’t change that often, we run this a couple of times per day.
What all of this means: Reasoning across boundaries
Alright, tech talk over.
The common thread we see with agents is that the complexity isn’t necessarily searching or retrieving.
It's reasoning across connected data in a single conversation: runtime, compile-time, and infrastructure at once.
And here's what makes engineers actually trust the answers: they're read-only queries against verified, observed data. The agent isn't generating a plausible-sounding response from training data. It's reading what's true and reasoning from there.
That's a different confidence level. "The graph says so" lands very differently from "the model reckons."
Having this confidence level, this reasoning, and this visibility means the possible implementations of this are endless; from security tabletops, to disaster simulation, to anti-pattern monitoring in code, runtime, infrastructure, to helping our build pipelines understand what really needs to be built and tested, to whatever stuff our resident mad scientists come up with next (we have a few). We haven’t even scratched the surface of what we could possibly do with this.
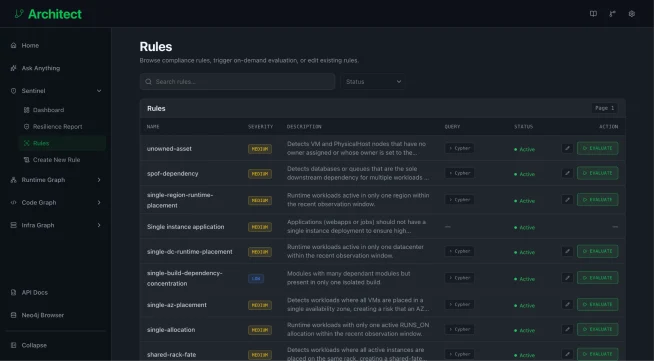
And just for your viewing please; here are some example resilience health rules we implemented on composite information. None of it is easy to do from a single graph alone.
Finally… What this means if you're an engineer using AI
If your agents don't have grounded context, they're expensive autocomplete.
If they do, they become genuine reasoning partners.
The investment was never really in the AI. It was in giving the AI something true to reason about: a factual substrate that encodes the institutional knowledge which would otherwise take a new engineer (or a new agent) months to absorb.
Architect is not a graph project.
It's the foundation that makes agentic engineering actually work at our scale. ---
This is the first post in a series. Next, we go one domain at a time: how agents use Architect to reason about runtime incidents, untangle compile-time complexity, and make sense of infrastructure resilience.