Podcasts and webinars
Using ElasticSearch and Apache Spark to predict and monitor payment volumes
Andreu Mora, Data Scientist at Adyen, explains how we use ElasticSearch and Apache Spark to predict and monitor payment volume.

No one wants downtime. Every second of downtime means lost revenue and customers. While all companies have strategies to prevent and respond to their own downtime, we also act proactively by monitoring our own customers’ activity.
Adyen processes the payments of many of your favorite companies: Spotify, Uber, H&M, and more. We want to do everything in our power to make sure payments are running smoothly. While we monitor different events and metrics on our platform in relation to each company (or "merchant," as we call them),payment volumeis the most important metric we monitor for our merchants.
If something goes wrong, we need to know as soon as possible. We then alert the merchant, providing them with the information they need to continue running their business smoothly.
However, monitoring payment volumes is not an easy task. There are challenges in determining whether reduced processing volumes are indicative of downtime. This means monitoring the volumes of thousands of merchants -- andbillionsof payments.
In this blog post, we'll explore how we historically approached this problem, and how we evolved our monitoring into a scalable, machine learning solution.
The legacy solution
Our first approach to monitoring processing volumes was that every hour, we would look at each merchant in isolation. We would select a few previous data points for that given time of the day and week for that merchant, and extract a mean.
We then compared the historic mean to the current hour's traffic. If the mean we measured was more thansomesigmas away from that at the current hour, we would flag the merchant’s volume as an anomaly. We’d then alert our development or support team to determine if the change in volume represented a "true" anomaly.
This was far from ideal in many dimensions:
- We had many false positives.
- We had no control or measure over how well we were detecting anomalies.
- Since the mean was calculated from a complicated SQL query that would compute in real time, these queries were heavy to run.
- We had no real benchmark. We had no estimate of how many alarms to expect, or whether we were blind on some merchants.
At some point, the number of false positives became so high that active monitoring was trimmed to track only a smaller selection of merchants.
The deficiencies of this approach piled on, and we knew we needed a different solution. With the amount of data involved, monitoring payments becomes a prime candidate for leveraging machine learning and big data.
Defining requirements
We approached monitoring a drop in payment volumes by forecasting the time series and flagging anomalies.
Time series forecasting is about attempting to predict the future. And since we aren't time travelers, we’ll have to rely on mathematics to extract a pattern and forecast a value given an input time series.
Flagging anomalies requires us to understand when something is wrong. There were particular challenges we had to overcome due to our data set (which we will cover later in this blog post).
With an established data science problem to solve, we defined a set of requirements for our solution:
- Identify a reasonable number of false positives (precision), or alarm rate in general. For example, a 5% alarm rate with 1,000 merchants on a 10 minute evaluation interval would result in 50,400 alert emails in one week!
- Recognise the anomalies (recall).
- Train for a lot of merchants with high granularity. This also means considering the latency at which we will be able to raise anomalies. For example, if our granularity is 30 minutes, we can only pick up issues 30 minutes after they happened. We need to be faster than that.
- Benchmark and harness the prediction performance.
- Score in real time in our payments platform.
- Work within security constraints: every library and tool has to be scrutinised by our security team and has the possibility of being rejected.
- Maintain robustness: if something goes wrong, we must keep up-and-running.
There were, however, still a few challenges to consider before diving in.
Challenges with our data
Anomaly predictions are rather impossible for us to anticipate, since our data shows no indication or feature that something is gradually deteriorating. It's a sudden drop. We decided to address this by extracting confidence estimates (say, at 95%, 97%, or 99% probability) and hypertune which quantile would work best performance-wise.
We are also solely looking at 1D data, since we cannot establish reliable correlations among our merchants. The only volume-impacting events that are shared between merchants are macroeconomic events, like holidays and Black Friday. Otherwise, we haven’t seen any strong correlations with other economic indicators.
Another problem is that we do not have a labelled dataset. However, we are working on this by enabling single-click false positive flagging from our payment platform. This will make it possible to feed back this information when enough cases have accumulated.
Separate platforms
As mentioned in ourprevious blog post by Serge, we use Apache Spark and Python to train over our Hadoop big data platform. However, our payments platform is based in Java. It has to be resilient and highly secure, as we have a number of security regulations to meet.
In order to connect these two different systems, we created Spidermon. Spidermon is a Java application that lives within the Adyen Payments Platform whose purpose is to retrieve real-time data and run algorithms and queries (i.e., monitors) to check whether what it is happening makes sense. Spidermon can be configured by operations since it offers a spectrum of monitors and parameters. Whenever Spidermon finds something odd, it raises a signal to Sonar, who enhances the context and routes it through a configured channel (e.g., SMS, email, Zendesk, our Back Office, etc.). The underperforming merchant is one of the monitors running in Spidermon.
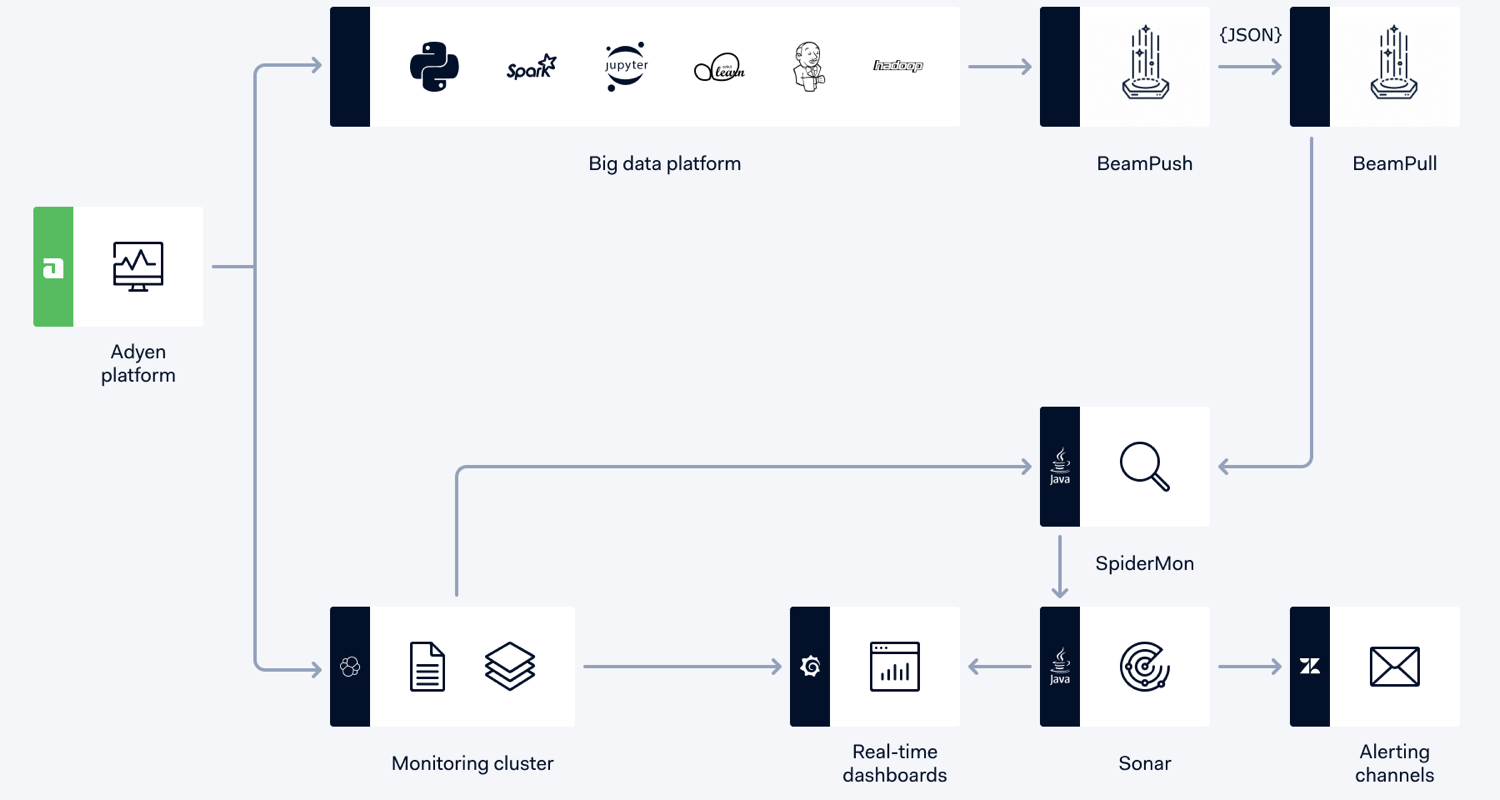
For real-time monitoring, we rely on a lightning-fast infrastructure based on ElasticSearch and Grafana. We alert support and development teams on several channels: SMS, emails, and our ticketing system. We can configure in our monitoring stack.
We are also exploring a ML-based solution that can train and serve serialised no-matter-how-complex models on the fly. While we are testing and getting security clearance for this, we had to code the models into Java ourselves.
Scoring in Java
We explored standard time series forecasting tools such as Facebook's Prophet (which was great) and StatsModel’s time series decomposition. However, they wouldn’t work for us, due to the security constraint of coding the scoring ourselves.
Implementing the models into Java meant that we had to master the mathematical terms behind our model -- and to keep it simple. This is aligned with our philosophy towards data science: we want to fully understanding the math behind our data science. We want to know what, why, and how to fix it. We do not want to rely on any "plug-n-play" approaches to data science.
Since we code the scoring, the data science workflow became as follows:
- Train in Spark.
- Extract a model (these are just numbers, not a serialised Python model).
- Develop the scoring equations in Java which predict in real time.
Choosing the right model
We tried a number of anomaly prediction techniques such as isolation forests, autoencoders, or ARIMA models. Due to issues such as poor performance (categorical) and the nature of our data (time series and floating point numbers), these models were not suitable for us.
There is a lot of literature on time series forecasting, but most of the models rely on a decomposition leading to a trend term, a seasonality term, and a residual. Some more advanced models, like Prophet, even allow for the injection of holidays.
We followed the same approach, but since we had a blank canvas to determine the equations, our goal was to come up with a mathematical model that would optimise Adyen’s business problems, all while keeping the scoring reasonably simple.
Features of our model
- A piece-wise, non-continuous linear trend would first estimate the trends and hinges of our time series, that can consist of years of data. We named this algorithm “trendspotting.” Note that the condition on non-continuity is actually needed and desirable, since we see volumes going up or down based on commercial decisions.
- For seasonality, we wanted to maximise human business cycles (e.g., hours of business) as much as possible. And while Fourier components work great for natural frequencies, it wouldn’t be able to understand events like “the last day of the month.” As such, we opted to use Gaussian Basis Functions instead.
- We are also able to model events (such as holidays). The objective is two-fold: to learn about recurrent events, and to prevent polluting our training set with known outliers.
- The residuals are then fit to a quadratic quantile regression to learn the confidence intervals of our errors in our estimates.
- These elements of the model can actually be applied either as a Generative Additive Model or a Generative Multiplicative Model. The choice of the additive or multiplicative model is a hyperparameter.
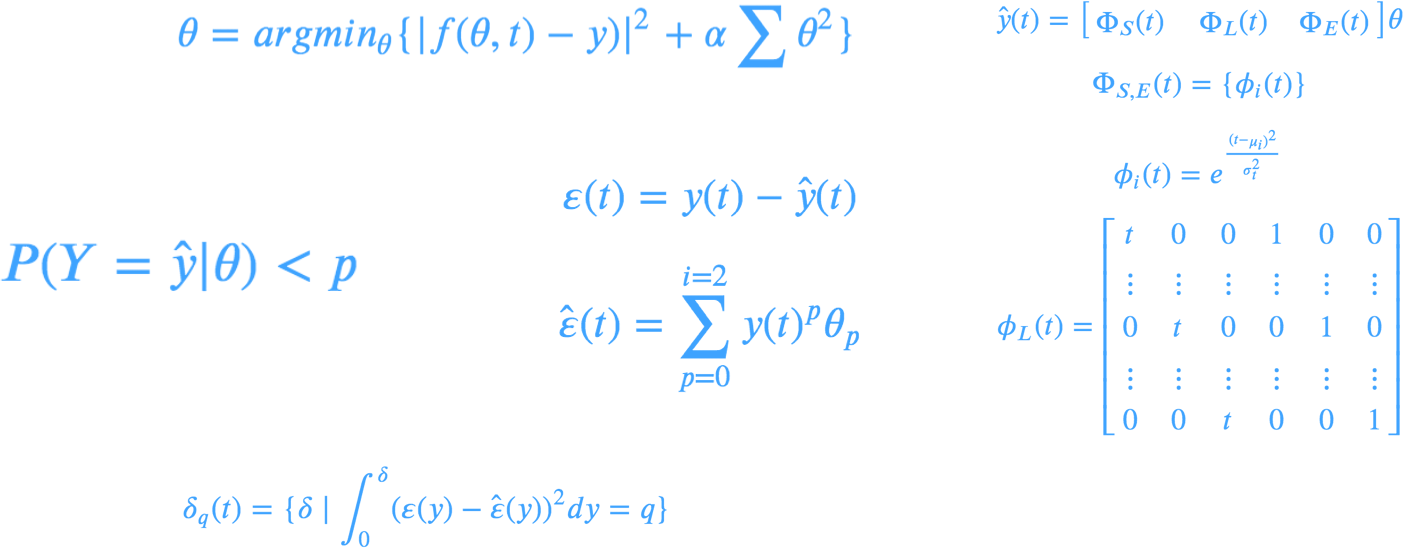
Equations for a Generative Additive Model
An anomaly would then be defined as anything that, given a model THETA, exceeds a certain confidence interval at a certain probability ALPHA.
As an added benefit, this approach pushes as much complexity as possible onto the model side at training time. We preferred straightforward scoring equations, since we had to develop the scoring algorithm ourselves in Java.
Predicting and scoring at different frequencies for ElasticSearch
The high-level overview of the model is fairly straightforward, however, the devil is in the details. Different merchants have volumes with different rates. For example, payment volume for a popular ride-sharing app could make thousands of transactions an hour, while a small brick-and-mortar baked goods store could make just a handful of transactions.
We cannot allow one payment to completely shift our predictions. Instead, we “zoom out” in order to distinguish a pattern with a sensible volatility. We undersample the time series to the most appropriate sampling interval so that we are able to extract a pattern. We first put them in buckets, allowing only certain intervals (e.g., 5 minutes, 10 minutes, or 1 hour for the smallest of transaction volumes). Once assigned to these buckets, only then would we attempt to train.
Note that this has an impact on when we’d score on the Java side. We are bound only to score at sampling times, and for this we transported a cron rule within our model. This also allows to scatter and control the load of the queries towards our ElasticSearch cluster already at training time. It’s a win-win!
Apache Spark: The training tech stack
As mentioned previously, we have a Spark infrastructure ready for training, while the model itself is mostly based on scikit-learn and pandas.
We overloaded pandas to create a new pandas Series child called TimeSeries in order to:
- Extract properties such as the day of the month, or the hour of the day.
- Retrieve the train set or test set.
- Periodically aggregate data.
We overloaded scikit-learn, creating transformers and estimators to train our models such that the models are easy to run (i.e., fit, predict, score). Additionally, we could use hypertuning and pipelining functionality within scikits.
This allowed us to be completely in control of how long the training runs last, since we could configure the number of executors in our Spark cluster, as well as the CPU cores we give to each one.
We then hooked up the training process within one DAG in our ETL infrastructure. After benchmarking, we transported the coefficients to our payments platform, where we can predict, score, and raise flags.

Example of a predicted week (test set) for merchants with high predictability. The red line represents real traffic, and the blue line represents predicted traffic with confidence areas at 90, 95, 97, 99% probabilities.
Hyperparameter optimisation
We are also able to do hyperparameter optimisation. In this case, we offer our algorithm a spectrum of possibilities for hyperparameters, and it will decide which combination of hyperparameters delivers the best performance.
We created our own custom TimeSeriesWeekSplit algorithm, which implements a more convenient way to do K-folds on time series than the one that ships with scikit-learn (TimeSeriesSplit).
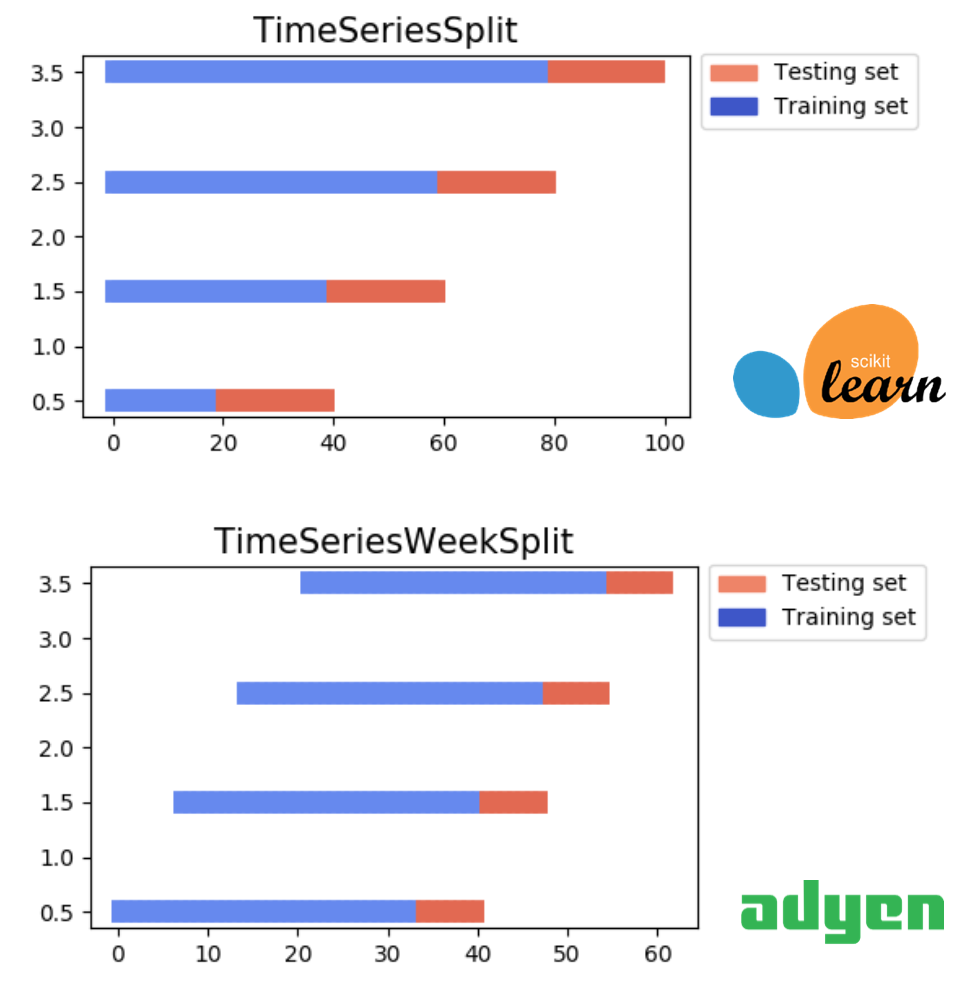
Since hyperparameter optimisation is expensive (due to the combinations of hyperparameters and folds), we trigger it manually and store those hyperparameters in Hadoop. The next training run (either manual or scheduled) will pick up the fresher hyperparameters.
Benchmarking
Every time there is a training, we analyse how well it was done. For one, this helps us roll out new improvements and features in the future. It also gives us confidence that the new model will work -- and that our good friends on-call in development and support won't get too many emails. We want them to keep smiling and greeting us in the cafeteria.
Overcoming unsupervised learning
As mentioned previously, we don’t have a labelled dataset (as of yet). This means that popular classification metrics such as precision or recall are not possible. We were able to gather metrics such as MSE and R2 on our prediction, but we were seemingly blind to anomaly detection. To overcome this, we derived a metric called “synthetic recall.”
Normally, recall is the percentage of true positives that were identified correctly. In our case, that would be knowing whether we would have detected an outage. Synthetic recall is inventing this outage. At training time, we perform several draws injecting random outages in our test set, and then measure our recall. If we did not estimate properly, and our confidence intervals are very high, then synthetic recall will tell us that we are doing a poor job.
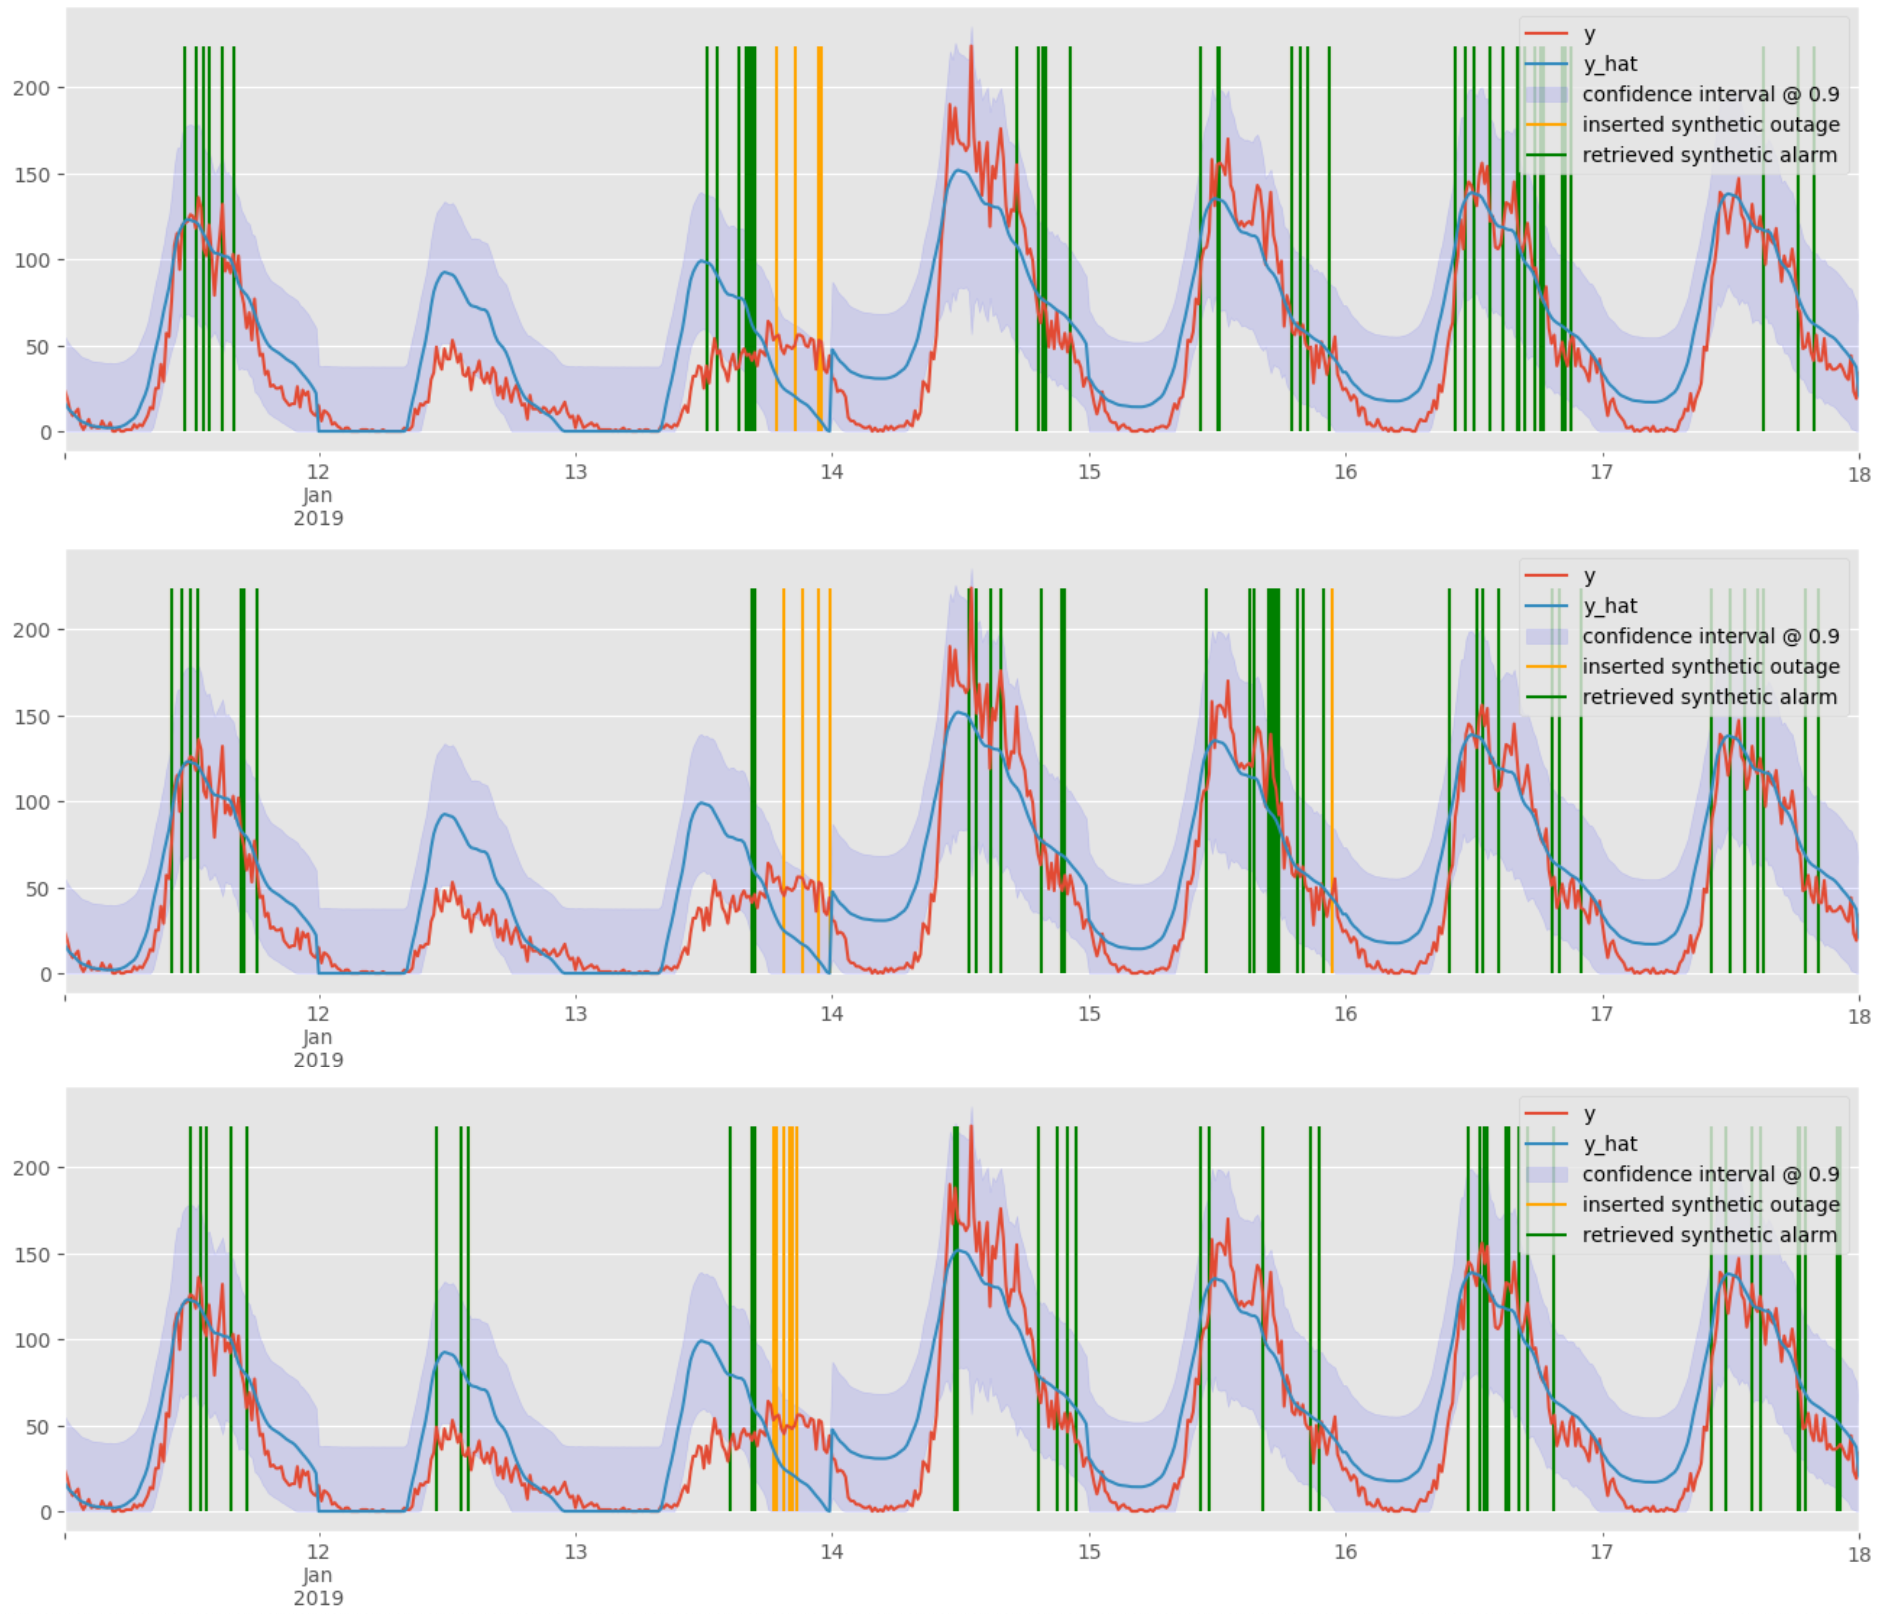
Model training: the yellow and green bars are synthetic outages we inserted into the data. The green are the outages we detected, the yellow are the outages we did not.
On the same line, we use the alarm rate on the test set as a proxy for precision. While not the most accurate, it gives us an estimate that it is quite workable. It is also important to keep to a reasonable amount, as each alarm result in emails being sent to support and development teams, and we don’t want to disturb our colleagues too much. In other words, if we have a merchant that will have a very high alarm rate (say 5%), we might choose not to roll it out.
Performance maps
In order to have a visual display on our predictions, we use scatter plots. They tell us how good our last training run performed, based on the volume of each account and the shopper interaction (i.e., ecommerce, physical shop, etc.). This way, we know at-a-glance the performance of our prediction.
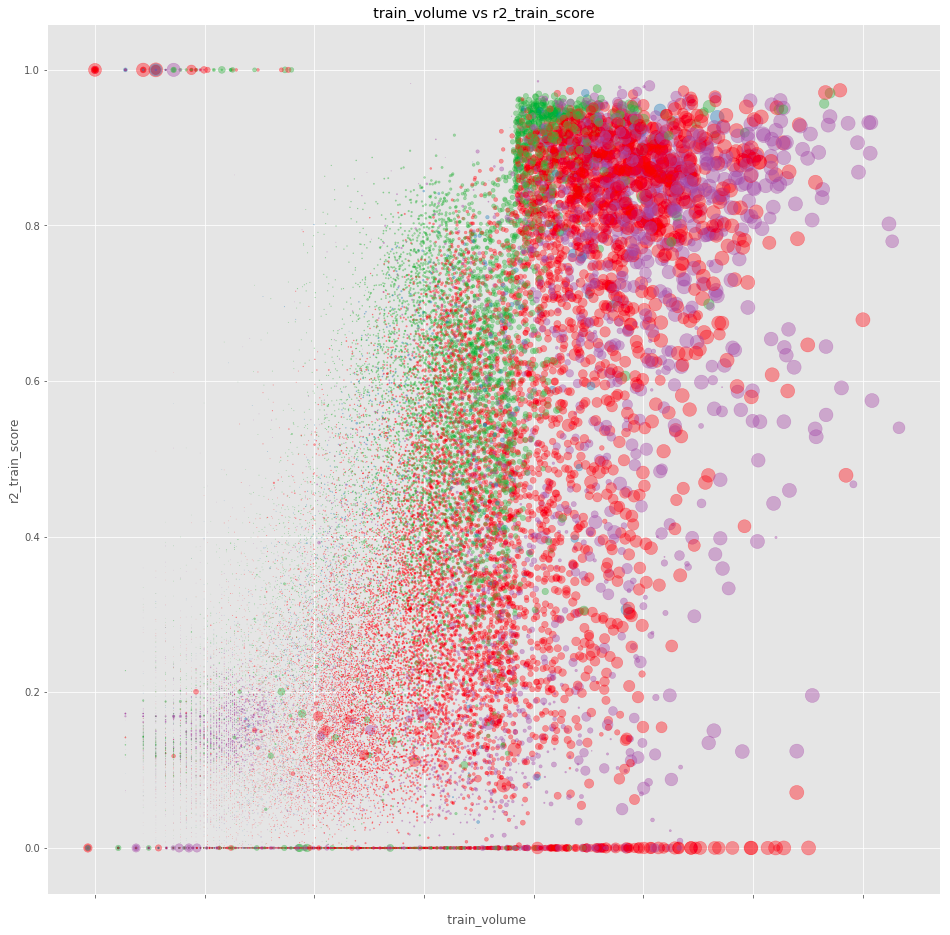
The shopper interaction is color-coded, with the x-axis representing volume, and the y-axis representing the r2 score on the training set for the prediction. Size is another representation of the training volume.
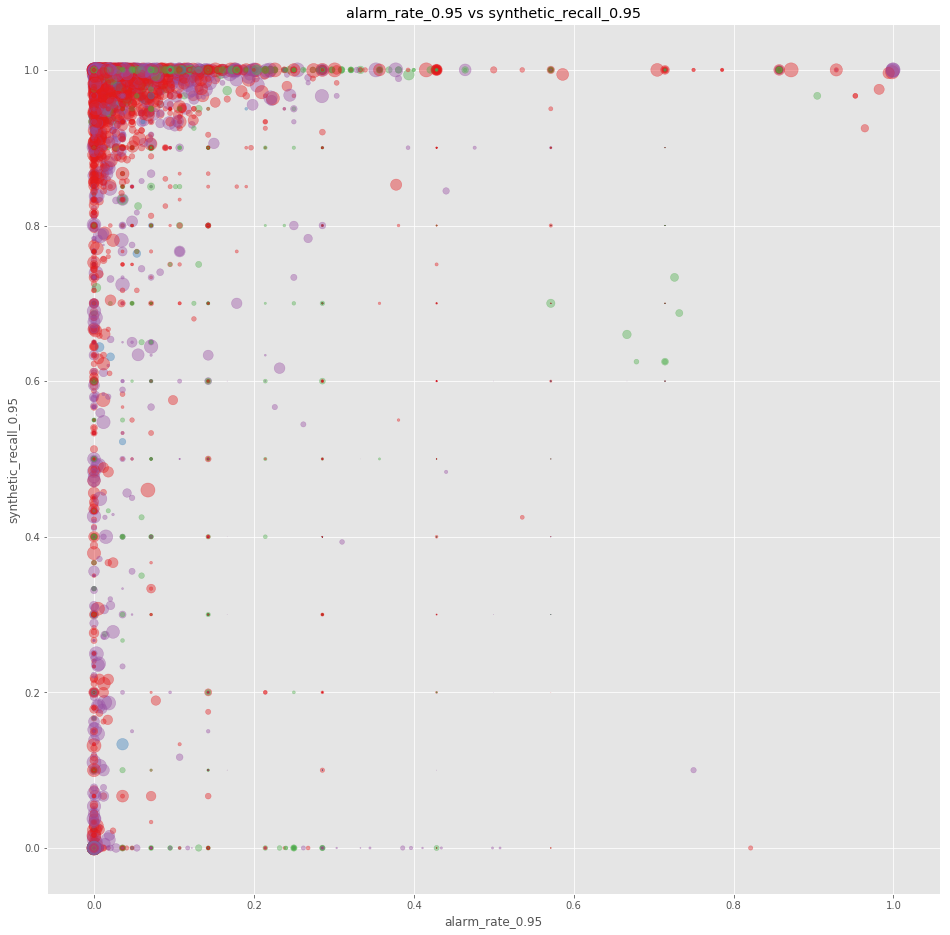
The shopper interaction is similarly color-coded. The x-axis represents the alarm rate with 95% confidence (being closer to 0 is ideal, though not being at 0 is not a guarantee of bad performance). The y-axis is the synthetic recall with 95% performance (being closer to 1 is ideal). Having all the dots clustered around (0,1) is indeed an indication of good performance.
Actual alerting
With our ML system in place for monitoring, we are able to send alerts to our merchant monitoring teams in support and development. For each alert raised, we create a custom Grafana dashboard for that alert.
The Grafana dashboard displays a merchant’s real transaction volume against the predicted volume. This helps our response team determine if an alert represents a real outage, and if so -- get the merchant’s system up and processing again.
Conclusion
We take monitoring very seriously, and we strive to use all our brain power to do smart things with it. We have designed, developed, and deployed a full machine learning model for time series prediction and anomaly detection that trains on Apache Spark -- all while scoring in real time in our secure and robust payments platform.
Our approach allows us to routinely spot issues in our merchants’ payment processing before they do. Needless to say, proactive and effective monitoring is essential to make sure our merchants continue running their businesses smoothly.
As a final anecdote on how important this feature is: Coen, our VP of Support & Operations in San Francisco, was in a meeting with a prospective merchant. The merchant asked, "How do we get in touch when something goes wrong?". Coen’s response: "You don't call us, we call you."
Apache Spark + AI Summit Panel
Technical careers at Adyen
We are on the lookout for talented engineers and technical people to help us build the infrastructure of global commerce!
Check out developer vacancies