Article
Why your payment acceptance rate isn’t the full story
Payment acceptance rate optimisation starts with having the right data. Here’s what your provider’s headline number may not be telling you.

When you evaluate a payment provider, payment acceptance rate is usually the first number you look at. It's also one of the most inconsistently defined metrics in the industry.
Two PSPs can measure the same transaction data and arrive at very different figures. That doesn't necessarily mean one provider's technology is performing better than the other's. The difference can come down to how each defines success.
That inconsistency affects how retry costs are allocated, how payment declines are reported, and whether the data in your dashboard reflects what’s actually happening at checkout.
To help ensure you get the full picture from your provider, this article explains:
How providers define and calculate acceptance rates
The hidden cost of retries
How Adyen ensures full transparency in both reporting and pricing
If you’d like to learn more about our approach to reporting and how we can help you achieve better results from your payments, get in touch.
What's the difference between payment acceptance rate and authorisation rate?
The terms 'payment acceptance rate' and 'payment authorisation rate' are often used interchangeably. In practice, what they measure can vary depending on the PSP.
Payment acceptance rate typically refers to the percentage of attempted payments that are successfully completed across card payments, digital wallets, and other payment methods.
Payment authorisation rate refers to the percentage of authorisation requests sent to the card network or issuer that are approved.
Depending on what a payment gateway counts, and where in the payment flow the measurement is taken, those two numbers can look significantly different.
The more useful question isn't what the rate is, but what sits behind the calculation.
Gross vs net auth-rate reporting
One of the biggest factors influencing an acceptance rate is whether the provider calculates it on a gross or net basis.
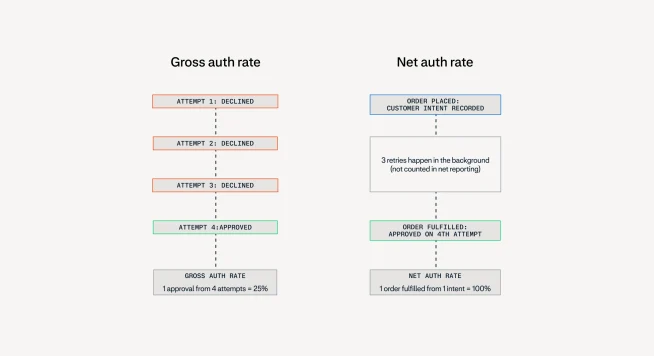
Gross auth rate counts every authorisation attempt sent to the card issuer, including those that fail. If a transaction is attempted four times before it's approved, all four attempts are counted.
Net auth rate looks at whether the order was eventually authorised, regardless of how many attempts it took to get there.
For example: one transaction that fails three times before succeeding on the fourth attempt produces a 100% net auth rate but just a 25% gross auth rate.
When looking at overall figures, Provider A, who reports net auth rates, could be claiming an auth-rate average of 97.9%. Whereas Provider B, who reports gross, appears to come in much lower at 91.44%.
That 6.5% difference doesn't necessarily tell you that Provider B is performing worse. It may instead reveal how much retry activity is sitting behind Provider A's stronger headline number.
Neither metric is wrong in isolation. Many businesses prefer to work from net rate as their primary metric, on the basis that what matters is whether the order was ultimately fulfilled. If net rate is your primary measure, however, understanding the activity behind that number is important.
Even among providers that claim to report gross authorisation rates, the calculation isn't always consistent. For example, some exclude online transactions that are blocked before reaching the issuer, such as those stopped by fraud detection tools. That changes the denominator and, ultimately, the rate being reported.
Why your provider may not want to show you gross
Gross auth rate exposes retry activity in a way that net rate doesn't. For payment processors using a high volume of retries to support strong headline acceptance rates, showing this activity can raise questions about what it costs to achieve that number. That's why understanding what sits behind your reported figures is important.
The true cost of a retry
Every retry incurs a processing fee regardless of whether the transaction ever reaches the card schemes. At a baseline of around USD $0.04 per attempt, the costs accumulate quickly. If your provider is retrying a transaction ten times before it succeeds, you're paying USD $0.40 to secure one sale.
For businesses with relatively low payment volumes and high transaction values, this might have limited impact. But for subscription models, recurring payments or high-frequency ecommerce, those costs can add up quickly.
Scheme retry penalties
In addition to the processing fee, retries that reach the card schemes might also trigger a formal penalty. The table below outlines Visa and Mastercard's penalty framework:
Gateway (PSP)
Rule
Per-attempt processing fee
Trigger
Every retry attempt, regardless of outcome
Penalty
~ USD $0.04 per attempt
Visa
Rule
Hard declines (Category 1: closed accounts, stolen cards)
Trigger
From the first retry attempt
Penalty
USD $0.10–$0.25 per retry
Visa
Rule
Soft declines (Categories 2–4: e.g. insufficient funds)
Trigger
After 15–20 retries on the same card within 30 days
Penalty
USD $0.10–$0.25 per subsequent attempt
Mastercard
Rule
Transaction Processing Excellence (TPE)
Trigger
More than 10 declined attempts on the same card within 24 hours
Penalty
Up to USD $0.50 per retry
Mastercard
Rule
Merchant Advice Code violations
Trigger
Retrying after a MAC 03 (do not retry) or MAC 21 (payment cancelled) within 30 days
Penalty
Up to USD $0.50 per instance
Data compiled from official Visa Global Product and Service Rules and the Mastercard Transaction Processing Excellence (TPE) framework updates. Penalties reflect standard domestic baseline fees and recent card network pricing adjustments for non-compliant retry behaviour.
These costs can be difficult to spot. Failed transactions don't appear in your settlement file, so retry-related fees tend to accumulate and appear as a lump sum at month end rather than at transaction level.
A strong payment acceptance rate, then, doesn't automatically mean an efficient one. High retry volumes can help lift the headline number while quietly eating into your margins.
Blind retries vs intelligent retries
Although retries come at a cost, that cost is usually worth it if the follow-up attempt is successful.
The issue is when retries happen without a clear strategy. Blind retries send the same transaction repeatedly regardless of decline code, timing, or scheme rules.
A more effective approach is to be selective about when another attempt is made. Intelligent retries send transactions with a soft decline or insufficient funds code a day or two later when funds are more likely to have cleared. False declines (where a legitimate transaction is rejected in error) are also worth identifying separately, because these represent recoverable revenue that blind retry logic often mishandles.
Adyen's embedded suite of optimisation tools, Adyen Uplift, uses smart logic to assess the refusal codes and determine if or when to retry. This helps improve payment performance where there is a genuine opportunity to recover the transaction, without adding unnecessary costs simply to protect a headline acceptance rate.
Why we report gross, and what you can do with that data
Adyen reports payment acceptance rate on a gross basis as standard, with full transparency regarding retries. Every message sent to a card issuer is counted and recorded, including failed attempts. If a transaction needs eleven attempts before approval, you'll see eleven attempts – rather than one successful transaction with the previous ten attempts hidden from view.
Some businesses prefer to work from net rate as their primary metric. With Adyen, both are available, giving you the context to understand what each number represents and investigate the retry activity between them.
We treat gross data as a diagnostic tool
A gross authorisation rate broken down by decline code lets you distinguish between different failure types: hard barriers like insufficient funds, technical failures like network timeouts, and authentication drops at the issuer level. Once the cause is visible, you can apply a more appropriate response. For example:
A spike in insufficient funds declines could point to a timing issue that our Auto Rescue tool can address
A pattern of authentication failures could indicate a problem with how payment data is being passed to the issuer, which we can address by optimising how that data is passed
Network timeouts could indicate a routing or connectivity issue within the payment infrastructure that Auto Rescue can fix
False declines can be identified by decline code pattern and escalated directly with the issuing bank
This type of diagnosis becomes much harder when failed retries disappear into a net figure. With gross reporting, a pattern of failures within a particular decline category becomes visible – and actionable.
We apply the same transparency to our pricing
Many providers issue a single bundled invoice at month end, which makes it difficult to attribute costs to specific transactions or identify where retry-related fees are accumulating. When those costs aren't clearly separated, it becomes harder to understand what a high net acceptance rate is actually costing your business, including its impact on cash flow.
Adyen's Interchange++ pricing model itemises the components of every successful transaction separately: interchange, scheme fees, and Adyen's processing margin. This gives you a clearer view of what you're paying for and where those costs come from.
What to ask your payment provider before you benchmark anything
A payment acceptance rate is only as useful as the methodology behind it. You need to know how it was calculated, what was included in the denominator, and whether the retries behind the final number are visible.
Before drawing any conclusions from a topline figure, ask your payment service provider four straightforward questions:
Are you reporting gross or net?
What counts as an attempt in your calculation?
Where do retry-related fees appear on my invoice?
How do I reconcile them against my reported acceptance rate?
Those answers can tell you far more about how your payments are actually performing than a headline percentage on its own.
If you'd like to learn more about our approach to reporting and how we can help you achieve better results from your payments, get in touch.
Payment acceptance FAQs
A false decline happens when a legitimate transaction is incorrectly rejected, typically by an overly cautious fraud detection system or issuer algorithm. This can directly affect conversion and customer retention: a customer whose valid payment is declined is likely to abandon the checkout and may not return. Unlike genuine declines, false declines represent potentially recoverable revenue, provided your payment data gives you enough detail to identify them. Breaking down gross auth rate by decline code is one of the most effective ways to spot false decline patterns, as they often appear around specific issuer response codes that indicate a transaction was flagged rather than genuinely rejected.